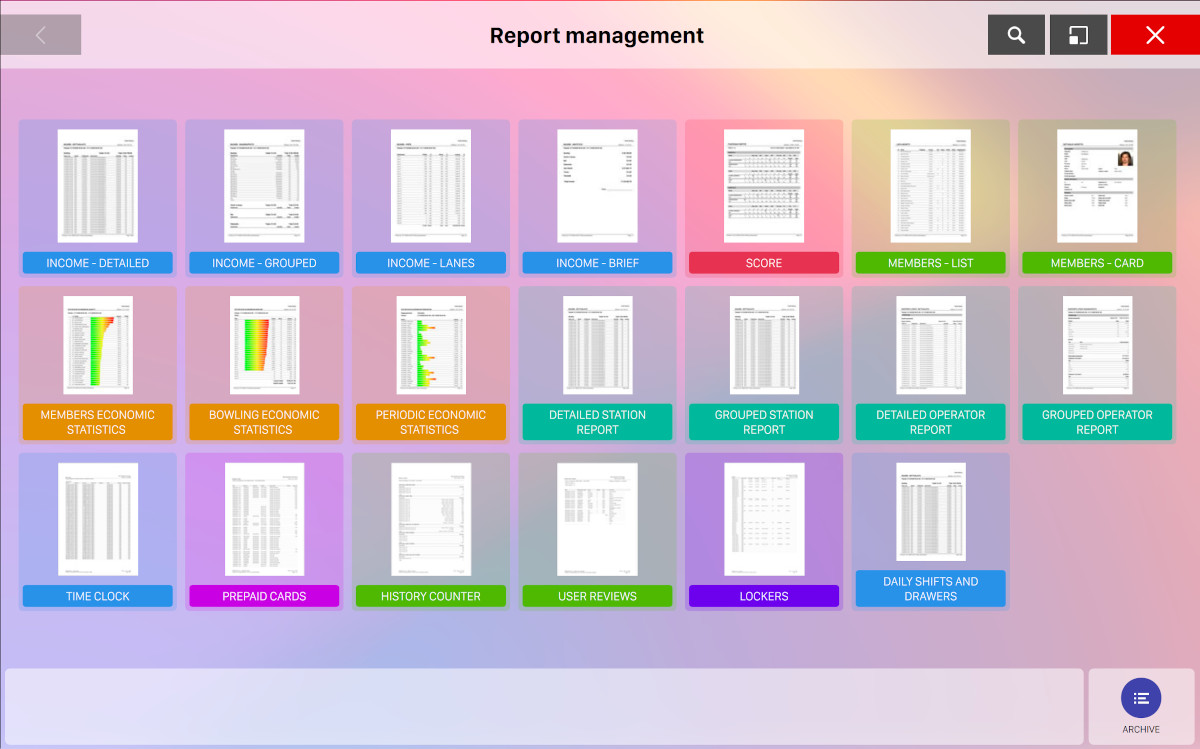
This window allows you to create a new report. A report is a document including different sort of data that can be printed or saved. There are several kind of reports that you can create.
To select the type of report click on the icons on the screen. For each type of report will be displayed a set of options that represents the parameters of the report. To create a report click on generate button. Once created, the report can be viewed on the report preview window and will be stored into the archive.
On the bottom right of the screen the Archive button takes to the report archive window.
12.1 Report types
12.1.1 Income - Detailed
-
Period considered: allows you to set a time shift for the reports
-
Include sales: choose whether to include sales events
-
Include financial movements: choose whether to include financial movements
-
Include assigned tips: choose whether to include tips
-
Include unarchived activities: choose whether to include unarchived activities in the report
This report shows a detailed list of all the incomes of the bowling center organized by department (bowling, time games, bar, ...). Note that this print could be long.
12.1.2 Income - Grouped
-
Period considered: allows you to set a time shift for the reports
-
Include sales: choose whether to include sales events
-
Include financial movements: choose whether to include financial movements
-
Include assigned tips: choose whether to include tips
-
Include unarchived activities: choose whether to include unarchived activities in the report
This report shows a list of all the incomes of the bowling center grouped by rate or by items.
12.1.3 Income - Lanes
-
Period considered: allows you to set a time shift for the reports
This report shows the total number of games or the time played and the income of each bowling lane. It is is useful to compare the usage of specific lanes.
12.1.4 Income - Brief
-
Period considered: allows you to set a time shift for the reports
-
Include sales: choose whether to include sales events
-
Include financial movements: choose whether to include financial movements
-
Include unarchived activities: choose whether to include unarchived activities in the report
This report prints the total incomes of the center grouped by department (bowling, time games, bar, ...).
12.1.5 Score
-
Period considered: allows you to set a time shift for the reports
-
Description: allows you to filter the bowling activities using the bowler’s name. Click on the ‘search‘ button to apply the filter or click the ‘cancel’ button to remove it
-
Lanes: allows you to filter the bowling activities based on the lane numbers
-
Activity archive: this table allows you to choose which bowling activity must be printed. You can select only one activity
-
Matches: allows you to choose which scores must be printed
-
Players: allows you to select a specific player or all the players for the report
-
Print statistics: this option allows you to print the scores and the rankings of the selected games
This report shows the statistics of a specific bowling activity. A bowling activity is intended as a set of games played on a lane by some players.
The scores print can be recalled also from Scores section, by clicking Print button.
12.1.6 Members - List
-
Sort: allows you to choose the print order
This report prints the list of all the members saved in the database. This can be recalled also from player archive section.
12.1.7 Members - Card
-
Sort: allows you to choose the print order
-
Order by ID
-
Order by Name
-
Order by Date of Birth
-
Order by Average
-
Order by Number of Games
Member: allows you to choose to print a single member’s data or to print all the members’ data Print Reserved data: allows you to choose to print the classified members’ information, as rates or notes Print scores: it prints the scores and when enabled, it allows you to select the Maximum number of games and the Period of time to print
-
This print can be recalled also from player archive section.
12.1.8 Members Economic Statistics
-
Sort: allows you to choose the order of data to be printed
-
Maximum number of items: allows you to select the maximum number of items to be printed. ‘All’ option is available
-
Period considered: allows you to set a time frame. If you select ‘Other’ option then you can customize the time frame by setting the starting and ending date
This report prints the graphic and the numeric statistics related to members’ transactions on the system. It can be recalled also from player archive section.
12.1.9 Bowling Economic Statistics
-
Zone to add: allows you to choose the section to print. Available options are:
-
Lanes
-
Rates
-
Departments
-
Operators
-
Stations
-
-
Period considered: allows you to set the time period to report
This report prints the graphic and the numeric statistics of the Bowling.
12.1.10 Periodic Economic Statistics
-
Group: allows you to group the events to print by a preset time shift
-
Period considered: allows you to set the starting and the ending period to report. The period change on the value of ‘Group’ option
-
Include every day: when the hourly average option is set in group, if checked shows all the averages for each hour of each day of the week. If you uncheck this option you can then select only specific days of the week
This report prints the periodic graphic and the numeric statistics of the sales.
12.1.11 Detailed Station Report
-
Period considered: it allows you to set the time period to report
-
Station: it allows you to choose a single workstation or all
-
Include server: it allows you to include the server on the report
This report shows for each workstation:
-
Financial Events: detailed list of all the income accomplished on that workstation
-
Date and time of the event
-
Operator who triggered the event
-
Department where the event occurred
-
Description of the event
-
Taxes applied to the item
-
Net price of the transaction
-
Gross income of the transaction
-
-
Events: list of all the events accomplished by the station
-
Date and time of the event
-
Operator who triggered the event
-
Description of the event
-
-
Financial movements: shows the detailed list of all economic transactions accomplished by the workstation
-
Date and time of the event
-
Operator who triggered the movement
-
Type of payment of the transaction
-
Number of receipt
-
Total amount of the transaction
-
-
Assigned tips: shows a detailed table related to the tips received by the workstation
Note that this print could be long.
12.1.12 Grouped Station Report
-
Period considered: allows you to set the time period to report
-
Station: allows you to choose a single workstation or all
-
Include server: allows you to include the server
This report shows for each workstation:
-
Financial Events: grouped list of all the income accomplished on the workstation
-
Events: list of the grouped events accomplished by the workstation
-
Financial movements: shows the grouped list of all economic transactions accomplished by the workstation (cash, checks, credit cards)
-
Assigned tips: shows a detailed table related to the tips received by the workstation
12.1.13 Detailed Operator Report
-
Period considered: allows you to set the time period for the report
-
User: allows you to choose a single operator or all
This report shows for each operator:
-
Financial Events: detailed table of all the incomes accomplished by the operator
-
Date and time of the event
-
Station where the event occurred
-
Department where the event occurred (bowling, time games, bar, ...)
-
Description of the event
-
Net price of the sale
-
Gross income of the sale
-
-
Events: table of all the events accomplished by the operator
-
Date and time of the event
-
Station where the event occurred
-
Description of the event
For more information on events type, see Event archive section
-
-
Financial movements: shows the detailed table of all the economic transactions accomplished by the operator (cash, checks, credit cards)
-
Date and time of the movement
-
Station where the movement occurred
-
Type of payment received
-
A note related to the payment
-
The number of receipt
-
The total amount of the movement
-
-
Assigned tips: shows a detailed table related to the tips received by the operator
-
Date and time when the tip was received
-
Station where the tip was received
-
Receiver of the tip. Note that it can be any operator
-
The total amount of the tip
-
Note that this print could be long.
12.1.14 Grouped Operator Report
-
Period considered: allows you to set the time period to report
-
User: allows you to choose a single operator or all
This report shows grouped information about the selected operator:
-
Financial Events: grouped list of all the income accomplished by that operator
-
Events: grouped list of the events accomplished by the operator. For more information on the events type see Event archive section
-
Financial movements: shows all the economic transactions accomplished by the operator, grouped by payment type (cash, checks, credit cards, ...)
-
Assigned tips: shows a detailed table related to the tips received by the operator
12.1.15 Time clock
This report is available only if you have enabled the time clock feature.
-
Period considered: select a period from the list
-
User: chose one ore more operator. Select all to include all the operators
-
Station: choose one or more workstations. Select all to include all the workstations
-
Rounding: select the rounding value from the dropdown list. This value will be used for rounding the calculation of the time clock events
On time clock reports it is possible to see the modification’s operator and notes that has been eventually made on the time clock event.
12.1.16 Prepaid cards
This report is available only when at least prepaid card has been sold and will show the list of generated prepaid cards or the list of related movements.
-
Report type: choose which report to print
-
Prepaid cards: show the overview of the prepaid cards created on the selected period
-
Movements: show the prepaid cards’ movements on the selected period
-
-
Period considered: select a period from the list
-
Status: filter by the status of a prepaid card
-
All
-
Only active
-
Only not active
-
Only expired
-
Only not expired
-
Only with credit
-
Only empty
-
-
Prepaid card code: this field is active only if the report type selected is ‘Movements‘ and will allow you to manually enter a prepaid card code, in order to print the report with the movements related only to the selected prepaid card
12.1.17 History counter
This report will show you an overview of events occurrences count on a selected period.
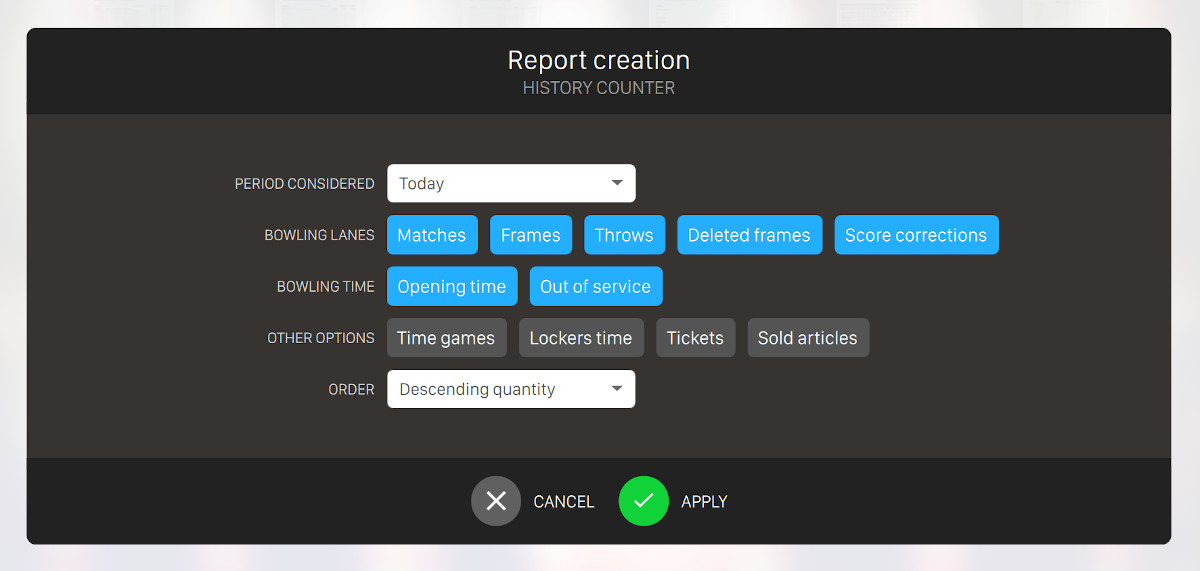
From this popup you can select:
-
Period considered: select a period from the list
-
Bowling lanes: select the type of the events you want to print regarding the bowling lanes
-
Matches
-
Frames
-
Throws
-
Deleted frames
-
Score corrections
-
-
Bowling time: select the type of the events you want to print regarding the bowling time
-
Opening time
-
Out of service
-
-
Other options
-
Time games
-
Locker time
-
Tickets
-
Sold articles
-
-
Order: select the order you want to apply for sorting the events
-
Descending quantity
-
Ascending quantity
-
Alphabetical
-
The report will be grouped by the main categories describe above and will show the count of the events for each single item. Quantity can be a sum of time or a sum of occurrences of the events.
12.1.18 Lockers
-
Sort: determines the order of the data to be printed. Available options are:
-
Order by expiration
-
Order by ID
-
-
Show only occupied lockers: check this option if you want to print only data on lockers that are currently occupied
This report shows a table showing data about lockers:
-
Id of the locker
-
Locker state (free, occupied, out of service)
-
Rent date, if occupied
-
End date, if occupied, and an end date of rent is set
-
Rent to: shows the name and surname of the member who is renting the locker
-
Member id: shows the id of the member who is renting the locker
-
Phone: shows the phone number of the user who is renting the locker
-
Paid up to: shows the date up to which the locker has been paid
12.1.19 Daily shifts and drawers
This report is available only if you have enabled daily shifts and drawers feature.
-
Period considered: choose a time frame for the generation of the report. Available options are:
-
Today
-
Yesterday
-
Current week
-
Last week
-
Current month
-
Last month
-
Current year
-
Previous year
-
Other: choose the starting and ending date and time from the selectors
-
-
User: chose one ore more operator. Select all to include all the operators
-
Station: choose one or more workstations. Select all to include all the workstations
-
Daily shifts: choose one or more daily shifts. Select all to include all the daily shifts
-
Drawers: choose one or more drawers. Select all to include all the drawers
-
Split by user: check this option to group the report data by user
-
Split by position: check this option to group the report data by workstation
12.1.20 User reviews
This report will show you the list of feedback that have been submitted by users who created a session using the Smart Bowl Kiosk feature and received the feedback request email.
-
Period considered: choose the period you want to consider from the list
-
Activity type: choose an option between:
-
Reservations
-
Orders
-
-
Rating: choose the rating value from 1 to 5
-
User name: search among the customers’ names
-
Show complete comment: allows you to print the complete review on the report
12.1.21 TM payments transactions
This report will show you the list of credit card transactions that have been created by using the TM payments integration.
-
Period considered: choose the period you want to consider from the list
-
Include refunded transactions: choose whether to include or not the transactions that have been refunded
-
Include failed transactions: choose whether to include or not the transactions that have failed
12.2 Generate a Report
Press the button Generate button to create the report. The icons on the right sidebar of the window allow you to perform some operations on the report:
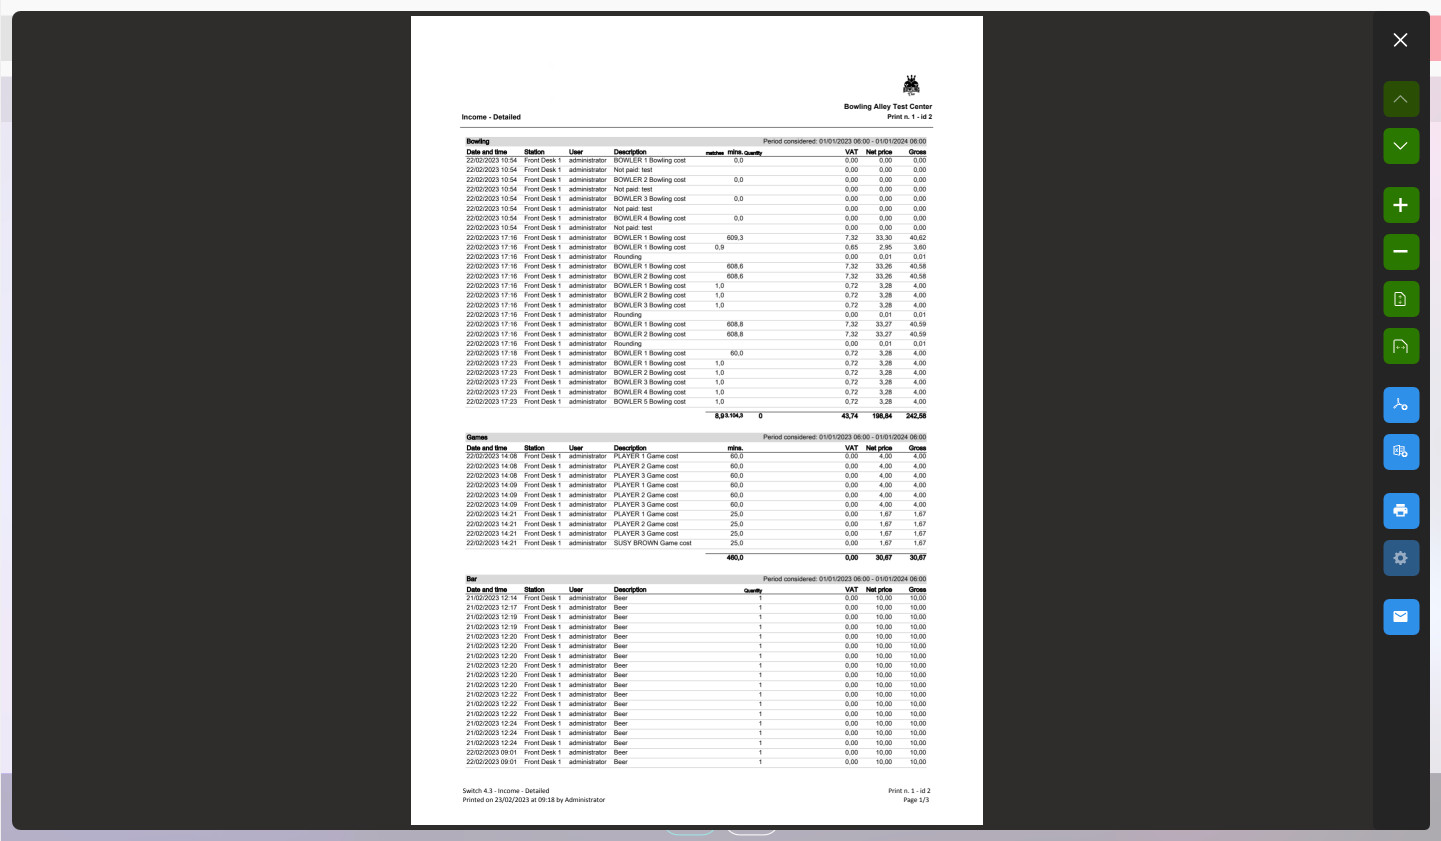
Move the mouse on the icons to see the functions:
-
Close button: closed the window
-
Arrow up and down buttons: allow you to go to the next/previous page
-
Plus and minus buttons: allow you to zoom in/out
-
Zoom to full page: zoom the page so that you can see the entire page on the screen
-
Zoom to page width: zoom the page so that the page width is equal to the window width
-
Save as PDF: allows you to save the report as a PDF file
-
Save as Excel: allows you to save the report with Excel format
-
Print: allows you to print the report on a printer
-
Print options: allows you to set the print options
-
Send report: open a window where you can send an email with the current report attached:
-
Addresses: type one or more email addresses separated by comma (,)
-
Subject: specify a custom subject for the email
one or more email addresses, a subject and send the report via email to the recipients you inserted
-
12.3 Report Archive
Press the button archive on the top right of the main window of ‘Report’ section. It will open a new page where you can see the list of all the generated reports.
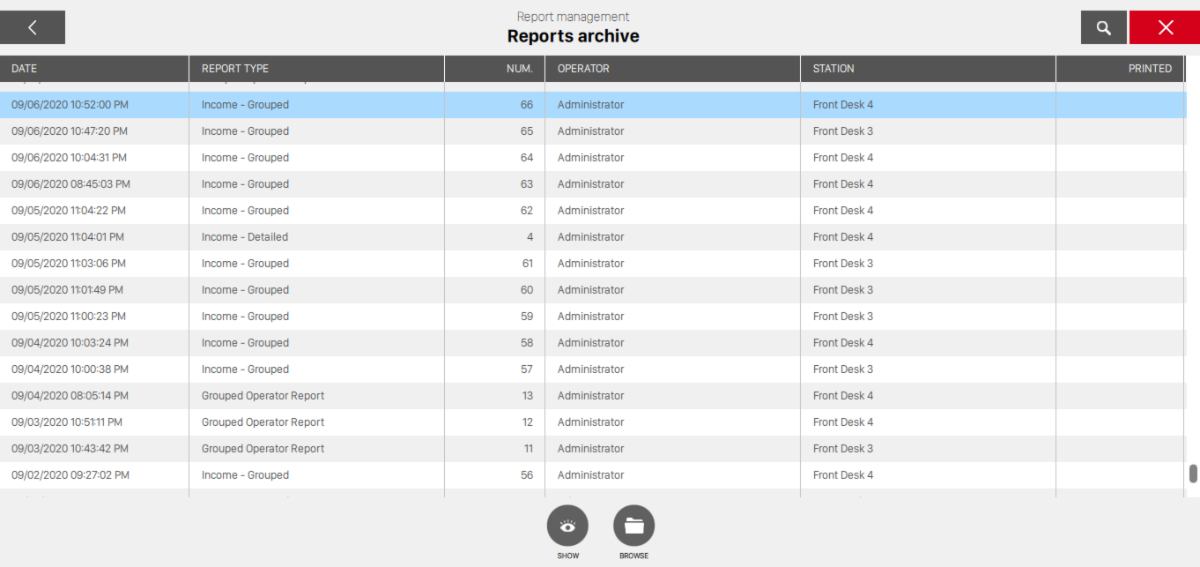
This window allows you to see / print the reports created by the Genie software. Each report is a printable document and it is stored into the Genie server as a PDF file.
The list shows the created reports. When a report is generated, the program stores the PDF file and a number of useful information:
-
Date: the date and time of creation
-
Report type: the report type
-
Num.: the progressive number for that report type
-
Operator: the name of the operator who created it
-
Station: the workstation where it has been created
-
Printed: indicates whether the report has been printed
For more information on how to cancel reports and on progressive numbers management see Clean database section.
On the top right of the screen click on the lens button to open the filters dropdown:
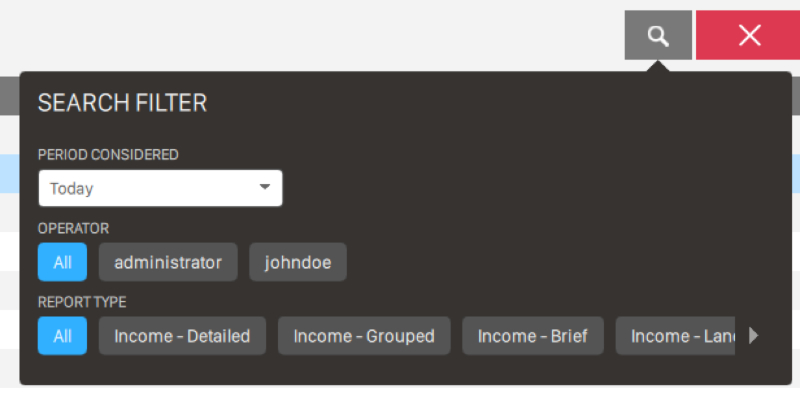
-
Period considered: allows you to chose the time interval to consider (today, yesterday, current month, etc.). It is also possible to choose ‘other’ and set a custom time frame
-
Operator: allows you to see the reports created by a specific operator
-
Report type: allows you to filter the archive by the report type
You can also perform some actions on the report table or on a single report:
-
Show: allows you to open a selected report
-
Browse: allows you to find the PDF files stored on the hard disk or on a removable device